
Raise 30 Day Repeat Rate: 4 QR Menu Analytics Fixes for Operators


QR menu analytics show who scanned, what they viewed, and, most importantly, whether they ordered or came back. The single biggest lever is post-scan conversion and 30-day retention, not scan volume. Start by fixing slow-loading pages, sharpening one underperforming photo or description, and capturing guest contact information at the point of scan.
TL;DR:
Focusing on view-to-order conversion and 30-day retention provides more revenue insight than scan volume alone, especially for repeat business.
Real-time dashboard data helps identify operational issues like slow-loading pages or drop-offs, while historical trends reveal seasonal and daypart performance.
Quick experiments such as swapping dish photos or adjusting placement can significantly improve sales without requiring major redesigns or technical changes.
Ensuring QR codes redirect properly and checking vendor support terms prevent costly reprints and reduce hardware risks, especially with unsupported platforms.
Regular, short weekly reviews of key metrics and testing small changes can drive continuous improvement in conversion rates and guest loyalty.
Table of Contents
What QR Menu Analytics Metrics Should You Track First?
Scan volume feels satisfying to watch, but it tells you almost nothing about whether guests ordered anything. The metrics that actually move revenue live deeper in the funnel, where browsing turns into a ticket or quietly turns into a table that leaves without ordering dessert.
A well-built dashboard tracks menu performance, tracks the guest’s path through your pages, and helps you spot revenue leaks before they become a pattern, according to features described by menu analytics platforms.
Focus on these signals:
Scan volume and unique scans: watch the trend line and tie spikes to specific table tents, receipt codes, or window signage.
Item views and view-to-order conversion: a dish getting heavy views but few orders has a description, photo, or price problem — not a demand problem.
Time on menu and exit points: guests who linger on the appetizer page and then close the browser are telling you something is unclear or unappealing.
Peak scan windows, device, and language splits: these drive staffing schedules and translation priorities.
Repeat-visit and 30-day retention: this is the number with the biggest dollar impact of anything on the dashboard.
Pro Tip: If you only have ten minutes a week for analytics, spend it on view-to-order conversion by item. It exposes menu problems faster than any other single metric.
How Do You Read a QR Menu Dashboard Correctly?
Real-time and historical views answer different questions, and mixing them up leads to bad decisions made in the heat of a Friday dinner rush.
Real-time data is for catching fires: a page that suddenly loads slowly, a spike in drop-offs mid-service, or an unexpected surge during a normally quiet hour. Historical trend views, by contrast, are where you compare week-over-week performance, daypart patterns, and seasonal shifts. A single slow Tuesday means nothing; four slow Tuesdays in a row means your lunch menu needs work.
Filter by these dimensions before drawing conclusions:
Location, for multi-unit operators comparing store performance
Table or zone, to isolate patio versus dining room behavior
Placement, since a table tent QR code and a receipt QR code attract different guest intents
Language and device, to catch localization or mobile rendering gaps
Always cross-check dashboard numbers against your POS or order data before making a pricing decision. Analytics platforms count clicks and views; your POS counts money. When the two disagree, trust the money.
Turning QR Menu Data Into Menu Changes That Work
Data sitting in a dashboard changes nothing on its own. The operators who see real lift treat every metric anomaly as the start of a small, fast experiment rather than a reason to overhaul the entire menu.
Triage the high-view, low-order items first. These dishes are getting attention but losing the sale somewhere between the photo and the “add to order” tap. Swap the photo, tighten the description to something more specific than “seasonal favorite,” or test a small price adjustment.
Fix placement and category imbalance. If your dashboard shows 40% of view time going to appetizers while entrées barely get a glance, your category order or page structure is steering attention in the wrong direction.
Measure promotional lift with tracked placements. Run a short, timed promotion through a distinct QR code or menu section, then compare its conversion rate against a control period.
Match staffing to peak scan windows. If Thursday’s 12:15 to 1:00 window consistently drives triple the scans, your kitchen and front-of-house staffing should reflect that, not a flat lunch schedule.
Run controlled tests before locking in permanent changes. A price increase or full layout redesign deserves an A/B test, not a gut call.
Operator playbooks consistently show that quick, low-cost changes like photo swaps and placement shifts deliver measurable lift with almost no technical effort. Detailed guidance on menu layout and photo sizing can help you execute these edits without guessing at formatting.
Why Does the 30-Day Repeat Visit Matter So Much?
The QR guest journey runs through four distinct stages: scan completion, order conversion, first-30-day retention, and long-term infrastructure survival. Each stage has its own failure points, and each one leaks revenue differently, according to a restaurant QR funnel analysis.
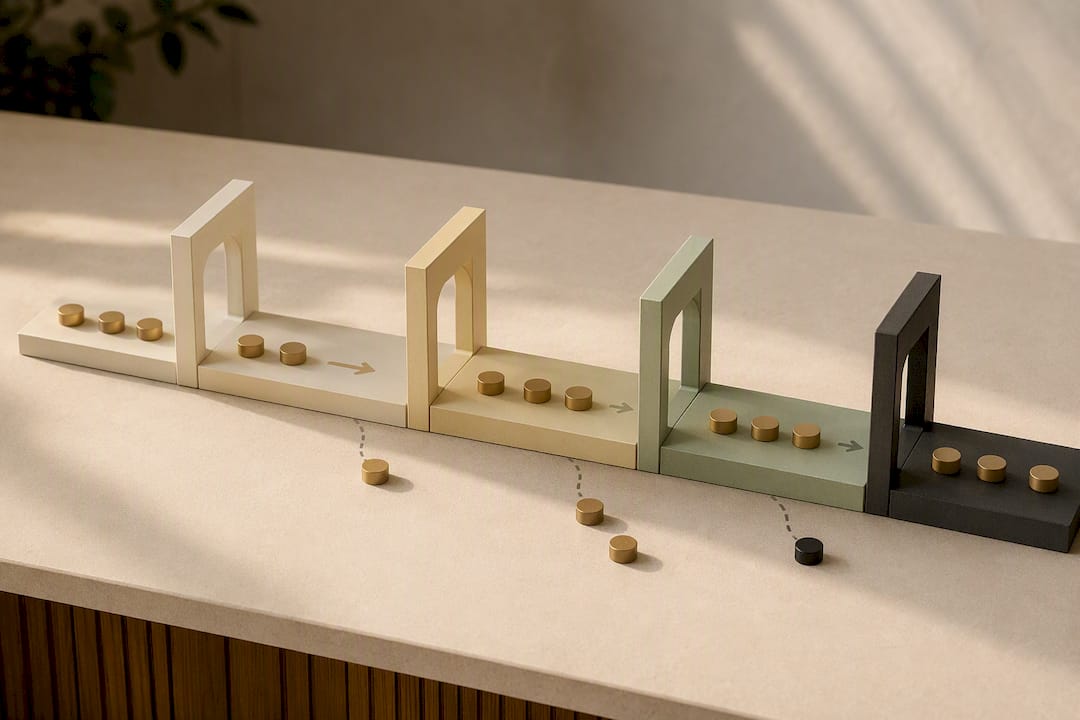
Retention is where the real money hides. Restaurants running their own ordering infrastructure, rather than depending entirely on third-party delivery apps, report a 67% repeat purchase rate compared to 23% for those leaning on outside platforms. That gap comes down to guest ownership: when you capture the relationship yourself, you can bring the guest back.
Practical tactics that move this number:
Capture email or phone number at the point of scan, tied to a small incentive
Use digital loyalty stamps to reward the third and fifth visit specifically
Offer a one-time return incentive tied directly to the original scan session
Watch repeat rate, churn risk, and the conversion lift attributable to guest-capture tactics as your core retention scoreboard.
Vendor and Infrastructure Checklist for QR Menus
The best analytics dashboard in the world is worthless if your QR code points to a dead page. Vendor and subscription failures are common enough that operators regularly face $200 to $800 in reprint costs when a vendor shuts down, hikes prices, or simply lets a domain lapse.
Before you commit to any platform, verify:
You can edit the QR destination without reprinting a single table tent or menu card
Your contract spells out uptime guarantees, support response times, and vendor-change terms
Page load time stays fast; redirects that add more than two seconds will tank your conversion rate
You have a reprint budget or a survivability clause protecting you from vendor collapse
POS integration and event attribution match cleanly, so your analytics and your sales numbers agree
Pro Tip: Ask any vendor directly: “If you shut down tomorrow, what happens to my printed QR codes?” Their answer tells you everything about how much reprint risk you are carrying. A step-by-step QR menu setup guide walks through exactly what to check before you print anything.
Four Quick Experiments to Run This Month
You do not need a developer or a data team to validate what your analytics are telling you. Pick one, run it for two weeks, and compare the numbers.
Photo A/B test. Swap the image on your single worst-converting dish and track the view-to-order lift.
Featured placement swap. Move a high-margin item to your known peak scan window and compare hour-by-hour conversion against the previous position.
Scan-captured coupon. Offer a first-visit discount tied to the QR scan, then track the 30-day return rate of those specific guests.
Language toggle test. If you serve international guests, compare order rates between your default language view and a translated version.
Fast, low-cost tests like these consistently outperform big menu redesigns in return on time invested.
What Should Operators Prioritize First With Limited Time?
Chase conversion and retention before you chase scan counts. A menu that gets scanned constantly but converts poorly is a marketing problem disguised as a technology problem.
Fix your infrastructure risk before you fix your photos. A dead QR code costs more in reprints and lost orders than a mediocre dish description ever will.
Commit to one experiment a month and a fifteen-minute dashboard review each week. That rhythm beats sporadic deep dives every time.
— Abhi
See How Mydigimenu Turns Scans Into Repeat Guests
Mydigimenu gives you the post-scan visibility this article just walked through, without locking your QR destinations to a vendor you can’t control. You get real-time and historical dashboards, editable QR targets you can update without reprinting a single table tent, POS integrations that keep your analytics and your sales numbers in sync, guest-capture tools with social login, and multi-language menus built for international guests.
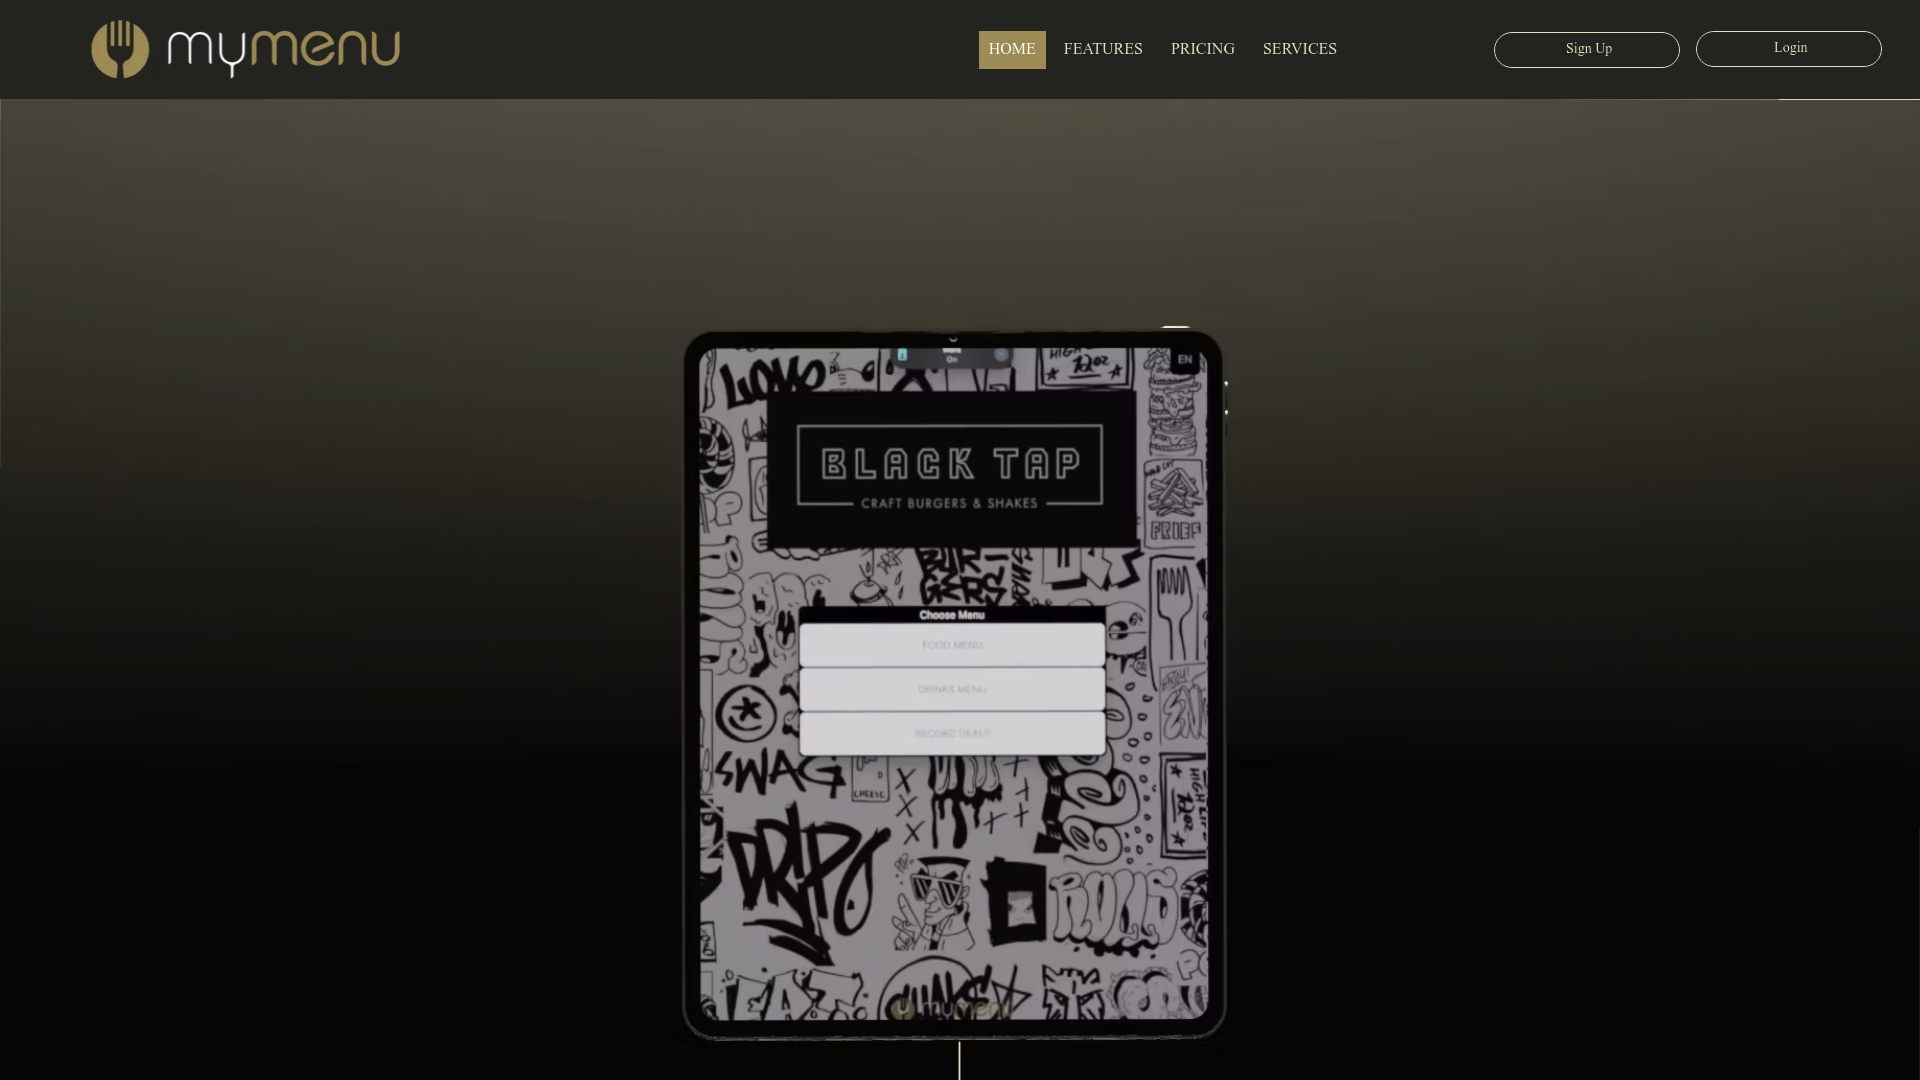
The QR Menu product page shows exactly how the analytics and guest-capture features work together, and if you run a hotel, The Hotel App extends the same tracking to in-room and concierge ordering. Pricing starts at $39 a month with the StartUp Menu plan, with higher tiers unlocking deeper analytics and CRM features as you grow. Check the plans and pick the one that matches where your restaurant is right now.
Sources
FAQ
What Is QR Menu Analytics?
QR menu analytics is the practice of tracking how guests scan, browse, and order from a digital menu, covering metrics like scan volume, item views, and conversion rate. The goal is turning that behavior data into concrete decisions about pricing, photos, and staffing.
Which Metric Matters Most for Revenue?
View-to-order conversion and 30-day repeat visit rate carry the biggest revenue impact of any metric on a QR menu dashboard. Restaurants with owned ordering infrastructure see a 67% repeat purchase rate versus 23% for those relying mainly on third-party platforms.
How Much Does a QR Menu Platform Cost?
Mydigimenu’s plans start at $39 a month for the StartUp Menu, with higher tiers such as Gold Menu and Platinum Menu adding deeper analytics, CRM, and loyalty features. A one-time setup fee applies; current prices and full plan details are available on the pricing page.
Can a Dead QR Code Really Cost Money?
Yes. Vendor shutdowns, lapsed subscriptions, and forgotten renewals can leave printed QR codes pointing nowhere, and operators typically face $200 to $800 in reprint costs to fix it. Choosing a platform with editable QR destinations avoids that cost entirely.
How Often Should I Review My Menu Analytics?
A short weekly check, roughly fifteen minutes, is enough to catch conversion drops and staffing mismatches early. Reserve deeper monthly reviews for testing photo swaps, placement changes, and pricing experiments based on what the weekly numbers reveal.
Recommended
Comments